Planetary motion follows predictable mathematical patterns. Johannes Kepler figured this out in the 1600s. Planets move in ellipses, sweeping equal areas in equal times. The farther from the sun, the slower they orbit. These rules govern our entire solar system.
I wanted to see these patterns come alive. Not through equations on paper, but through animation on screen. The challenge was turning orbital mechanics into something visual and intuitive. The result is a browser-based simulation that shows all eight planets (plus Pluto) circling the sun in real time.
What It Does
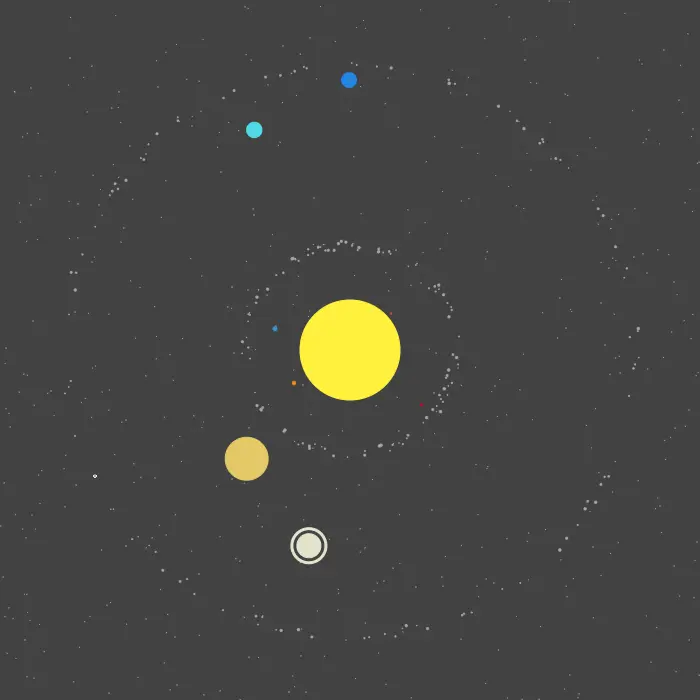
The simulation renders the entire solar system on an HTML Canvas. Each planet orbits the sun at its correct relative speed. Mercury zips around in 88 days. Neptune takes 165 years. The proportions match reality.
The scene includes more than just planets. Hundreds of asteroids populate the main belt between Mars and Jupiter. Another cluster orbits beyond Neptune in the Kuiper belt. Five hundred stars twinkle in the background. Saturn even has its iconic rings represented as concentric circles.
Sistema Solar
Circular Motion Math
Each planet’s position is calculated using basic trigonometry. The x-coordinate is the center plus the orbital radius times the cosine of an angle. The y-coordinate uses the same formula with sine. This traces a perfect circle as the angle increases.
The key insight is that angular velocity depends on orbital period. Each planet has a fixed speed value derived from its real orbital duration. Mercury moves about 0.07 radians per frame. Neptune moves 0.0001 radians per frame. This creates the dramatic speed difference you see on screen.
Every frame, the simulation:
- Increments each planet’s angle by its speed
- Recalculates x and y positions from the new angle
- Clears and redraws everything
Rendering with Canvas
HTML Canvas provides a simple API for drawing shapes. The simulation uses two basic primitives: circles for celestial bodies and rectangles for the background and stars.
Drawing happens at roughly 125 frames per second through a timer. Each frame clears the canvas with a dark gray rectangle. Then it draws the star field, the sun, all planets, and both asteroid belts. The layering order matters. Stars go behind everything. The sun goes in the center. Planets and asteroids draw on top.
Colors match the real planets reasonably well. Earth is blue. Mars is red. Jupiter has a yellowish tint. Saturn and its rings share a cream color. The visual effect is immediately recognizable.
Scaling Reality
The solar system spans billions of kilometers. Fitting it on a 700-pixel canvas requires compression. I used a scaling factor that makes everything visible while preserving relative sizes.
Planet radii are multiplied by 0.3. This keeps Jupiter large and Pluto tiny, but everything remains visible. Orbital distances are compressed more aggressively. The gaps between outer planets would otherwise push them off screen.
This approach sacrifices accuracy for clarity. In reality, if Earth were one pixel, Neptune would orbit several screens away. The simulation prioritizes the visual experience.
Asteroid Belts
Real asteroid belts contain millions of rocks. I simulated 100 per belt, which creates the visual impression without killing performance.
Each asteroid gets randomized properties. Size varies slightly around 0.8 pixels. Orbital distance varies within a 10-pixel band. Starting positions scatter randomly around the circle. The result looks chaotic and natural.
The main belt sits between Mars and Jupiter with a 5-year orbital period. The Kuiper belt stretches beyond Neptune with a 200-year period. Both regions have distinct visual identities on screen.
The Star Field
Stars are just tiny white rectangles placed at random coordinates. Five hundred of them fill the background without looking cluttered. Their positions stay fixed while planets orbit past them.
This simple touch adds depth to the scene. Without stars, the animation would feel flat. With them, you get a sense of space stretching infinitely behind the solar system.
Why Vanilla JavaScript
The entire project runs without libraries or frameworks. No React. No Three.js. Just plain JavaScript manipulating a canvas element. This constraint forced me to understand exactly what was happening.
Canvas drawing is surprisingly simple. A few methods handle everything: beginPath, arc, fill for circles. fillRect for rectangles. Setting fillStyle changes colors. The browser handles all the low-level graphics.
The codebase totals under 200 lines. Three files handle shapes, planet behavior, and the main loop. This simplicity makes the code easy to read and modify.
What I Learned
Building this simulation taught me several things about animation and graphics programming.
First, smooth animation requires consistent timing. The 8-millisecond interval creates fluid motion. Longer intervals make planets jump. Shorter intervals waste CPU cycles.
Second, object-oriented design helps organize graphical elements. Each planet carries its own position, color, speed, and orbit. The main loop just tells everything to move and draw itself.
Third, realistic simulations need simplification. Perfect accuracy would require elliptical orbits, gravitational interactions, and true-to-scale distances. None of that would be visible at this zoom level. The goal is communication, not precision.