Queue theory problems look simple on paper. Customers arrive. They wait in line. A server processes them. They leave. But predicting how a real queue behaves is surprisingly hard. How long will customers wait on average? How many servers do you need to keep wait times reasonable? At what point does the system become unstable?
These questions matter in real systems. Banks, hospitals, call centers, and web servers all deal with queues. Bad predictions mean frustrated customers or wasted resources.
I built SimThesis to answer these questions through simulation. It runs directly in the browser. You define your queue system, and the tool shows you how it behaves over time.
Why Simulation Matters
Mathematical formulas exist for simple queue systems. An M/M/1 queue has closed-form solutions for average wait time and queue length. But real systems are rarely that simple.
What if arrivals are not random? What if service times follow a different distribution? What if you have multiple servers with different speeds? What if customers abandon the queue after waiting too long?
Each complexity breaks the simple formulas. Simulation handles these cases. You model the system as you understand it. The simulator runs thousands of virtual customers through and reports what happens.
How SimThesis Works
The tool uses discrete-event simulation. Instead of advancing time continuously, it jumps from one event to the next. An arrival happens. Then a service completion. Then another arrival. The simulator processes events in order and tracks system state.
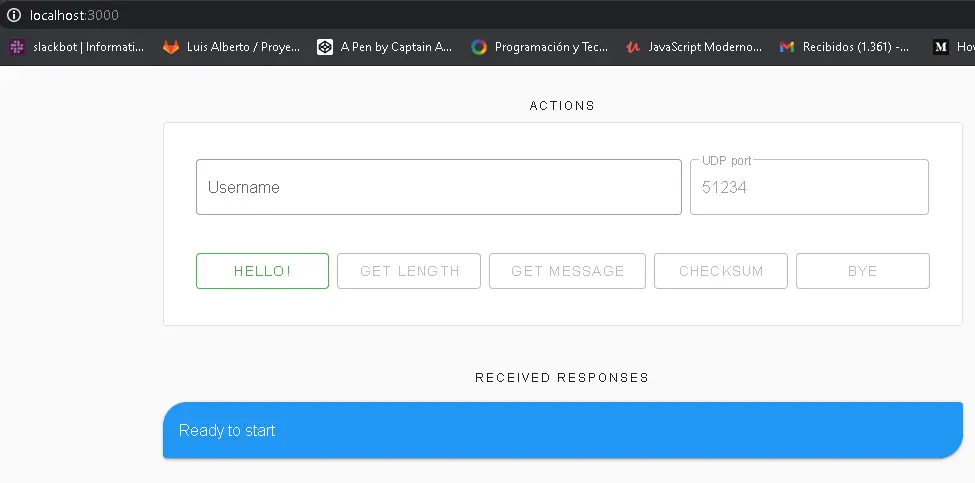
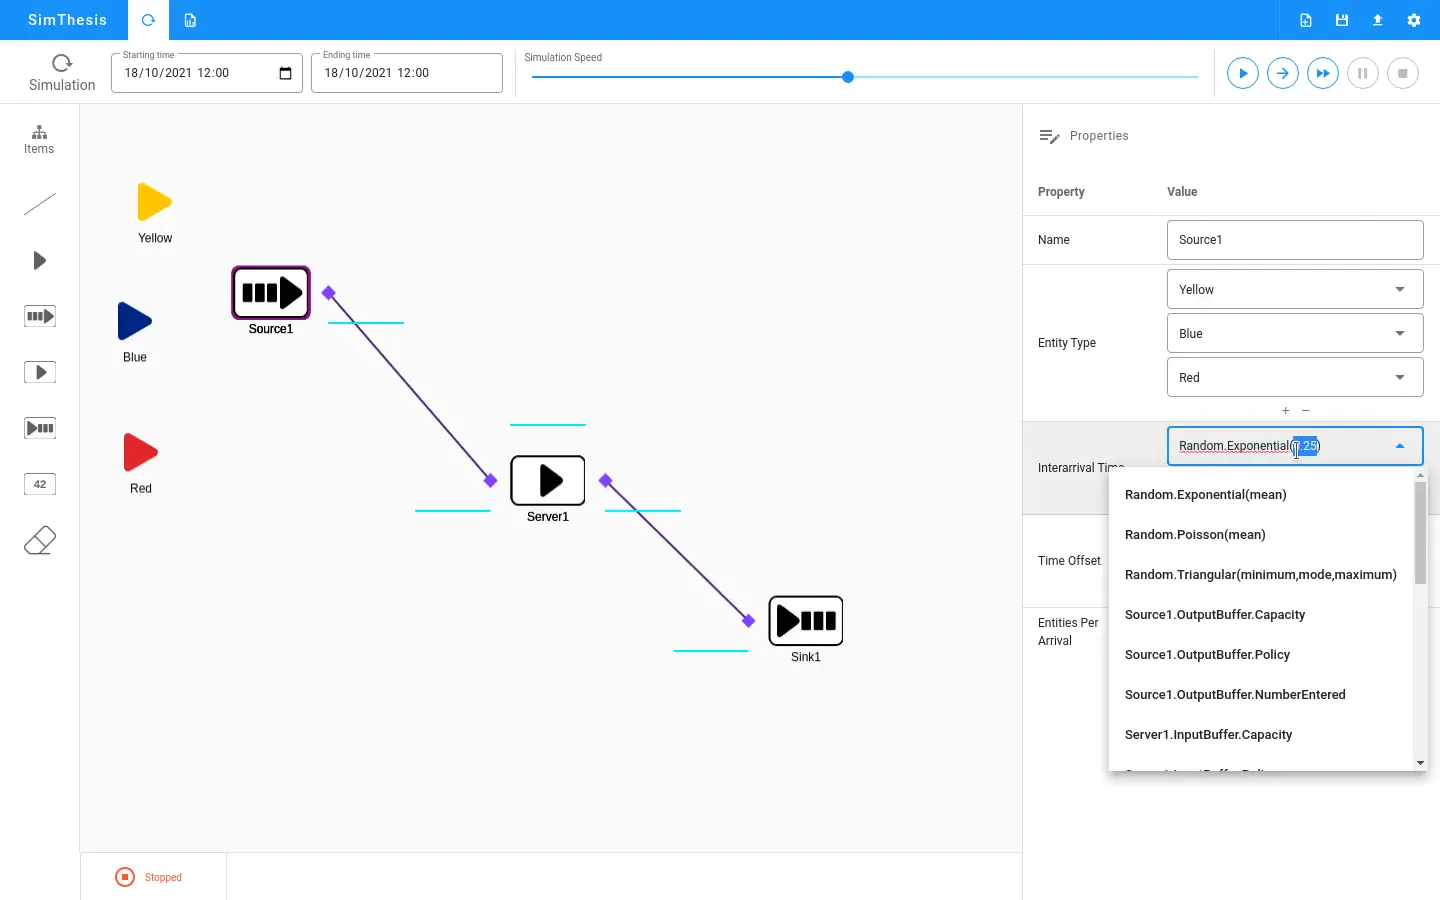
You configure the simulation through a web interface. Define arrival patterns using probability distributions. Set service time distributions for each server. Specify the number of servers and queue capacity.
The simulator runs your configuration and streams results back in real-time. You watch the queue build and drain. Charts show wait times, queue lengths, and server utilization as the simulation progresses.
The Validation Purpose
SimThesis exists to validate the General Simulation Framework. That framework provides building blocks for simulation tools. Entities, resources, events, queues, and statistical collectors. But building blocks mean nothing without proof they work correctly.
A queue simulator is a perfect test case. Queue theory provides known results for comparison. If the simulator produces the expected average wait time for an M/M/1 queue, the framework is working correctly.
SimThesis passed this test. The simulated results matched theoretical predictions. This validated the framework for more complex applications.
Real-Time Visualization with Socket.IO
Simulations can take time. Running a million customers through a queue takes more than a few milliseconds. Users need feedback while they wait.
Socket.IO handles the communication between server and browser. The Python backend runs the simulation and emits progress updates. The Vue.js frontend receives these updates and renders them immediately.
The chart updates smoothly as new data arrives. Users see the queue length fluctuate. They watch average wait time stabilize as the simulation gathers more data. This immediate feedback makes the tool feel responsive even during long simulations.
The architecture keeps the heavy computation on the server. Browsers handle rendering. This split lets the simulation run fast while keeping the interface smooth.
The Event Loop
Discrete-event simulation follows a simple pattern. Maintain a priority queue of future events sorted by time. Pop the next event. Process it. Schedule any new events it generates. Repeat until done.
An arrival event creates a customer entity. If a server is free, the customer starts service immediately. Otherwise, they join the queue. The arrival event also schedules the next arrival.
A service completion event frees the server. If the queue has waiting customers, the next one starts service. The completion schedules the departure.
This loop handles arbitrarily complex systems. Add more event types for different behaviors. The core algorithm stays the same.
Statistical Collection
Raw simulation data means little without analysis. SimThesis collects statistics throughout each run. Average wait time. Maximum queue length. Server utilization percentages. Confidence intervals around estimates.
The collector handles warm-up periods. Early simulation data is unreliable because the system starts empty. The tool discards initial samples before computing final statistics.
Batch means help estimate confidence intervals. The tool groups samples into batches and computes the variance between batch averages. This variance determines how confident we are in the overall average.
Probability Distributions
Queue behavior depends heavily on the distributions you choose. SimThesis supports common options:
- Exponential for random arrival processes
- Normal for service times with natural variation
- Uniform for bounded random values
- Deterministic for fixed intervals
Each distribution takes parameters through the interface. Exponential needs a rate. Normal needs mean and standard deviation. The backend validates inputs before running.
Choosing the right distribution matters. Exponential arrivals with exponential service gives the classic M/M/1 queue. Change either distribution and the behavior changes too.
The Technology Stack
The backend runs Python with Flask. Flask handles HTTP requests for configuration and simulation control. The General Simulation Framework provides the actual simulation engine.
Socket.IO adds real-time communication. The simulation emits updates as it runs. Flask-SocketIO bridges Python and the WebSocket protocol.
The frontend uses Vue.js with TypeScript. Components handle configuration forms, result displays, and live charts. TypeScript catches type errors before they reach production.
Node.js serves the frontend during development. In production, the static files deploy separately from the Python backend.
Challenges I Faced
Real-time updates required careful design. Emit too often and the network floods. Emit too rarely and the interface feels laggy. I settled on batching updates every few simulation time units.
Browser performance needed attention too. Drawing thousands of data points on a chart slows things down. I limited the visible data window and aggregated older samples.
The General Simulation Framework needed extensions for web use. The original design assumed batch processing. I added hooks for progress callbacks and early termination.
What I Learned
Building SimThesis taught me how simulation engines work internally. The discrete-event pattern applies beyond queues. Manufacturing systems, computer networks, and logistics all use the same approach.
I learned about statistical analysis of simulation output. Confidence intervals require careful handling. Autocorrelation in samples complicates variance estimation. The warm-up problem affects every simulation study.
The project also showed me how to build interactive visualizations. Streaming data to a browser chart has its own set of challenges. Balancing update frequency against performance requires experimentation.
Most importantly, the project validated a larger piece of work. The General Simulation Framework became more credible because SimThesis worked. Building tools to test your tools is time well spent.