Graph theory sounds abstract until you see it in action. Networks, maps, social connections, game AI. Graphs are everywhere. But explaining them to students who have never seen a data structure can be frustrating.
I was running the Artificial Intelligence club at my university. We needed hands-on exercises that made abstract concepts concrete. Reading about breadth-first search is one thing. Watching it find a path through a maze is another.
So I built two interactive challenges. Both run in the browser with pure JavaScript and HTML5 Canvas. No frameworks, no dependencies. Just the code and a visual playground.
What It Does
The project contains two separate challenges that teach different aspects of graph algorithms.
The first challenge visualizes a graph as a network of connected nodes. Users can drag nodes around the canvas. The system finds the shortest path between any two nodes using recursive search. When you select start and end points, the path lights up in red.
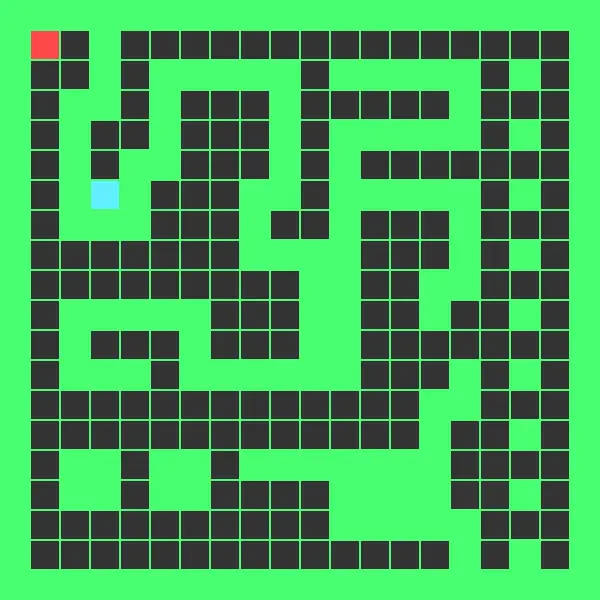
The second challenge is a maze pathfinder. Users draw walls on a grid to create obstacles. The algorithm then finds a path from start to goal, marking each step along the way. This demonstrates how search algorithms work in spatial contexts.
Both challenges share the same rendering system but tackle graphs from different angles. One shows the abstract structure. The other shows the practical application.
The Graph Challenge
The first challenge represents a graph using an adjacency matrix. Each row and column corresponds to a node. A 1 means those nodes are connected. A 0 means they are not.
let cities = [
  [0,1,0,0,0,0,0,0,0,0,1,0,0],
  [1,0,1,0,0,0,0,0,0,0,0,1,0],
  [0,1,0,1,0,0,0,0,0,0,0,0,0],
  // ... more rows
];
The visual layout arranges nodes in a circle using trigonometry. Each node sits at an angle calculated from its index. This keeps the display clean and makes connections easy to trace.
Users can drag any node to a new position. The edges redraw automatically, keeping the visual accurate even as the layout changes. This interactivity helps students understand that the graph structure is separate from its visual representation.
The Pathfinding Algorithm
Finding the shortest path between two nodes uses recursive depth-first search with backtracking. The algorithm tries each neighbor, marks nodes as visited to avoid cycles, and tracks the shortest route found.
The key insight is that graphs can have multiple paths between any two points. The algorithm explores all options and keeps the shortest one. If a neighbor leads nowhere, it backtracks and tries another.
The search marks nodes as visited before exploring them. After returning from a recursive call, it unmarks them. This lets the algorithm find all possible paths without getting stuck in loops.
When the shortest path is found, the system colors those edges red. This visual feedback shows students exactly which connections form the optimal route.
The Maze Challenge
The second challenge treats a 2D grid as a graph. Each cell is a node. Adjacent cells share edges unless a wall blocks them.
The maze uses a different representation. Instead of an adjacency matrix, it uses a 2D array where values indicate cell types:
0is an empty floor1is a wall2is the start position3is the end position
Users can click and drag to draw or erase walls. The interface responds immediately, letting students experiment with different maze layouts.
Breadth-First Propagation
The maze solver uses wave propagation, a variant of breadth-first search. Starting from the initial position, it assigns distances to neighboring cells. Then it processes those neighbors, assigning distances to their unvisited neighbors.
The algorithm spreads outward like ripples in a pond. Each wave front moves one step further from the start. When a wave reaches the goal, the algorithm stops.
To reconstruct the path, it works backward from the goal. Each step follows the decreasing distance values back to the start. The final path shows up in pink on the grid.
This approach guarantees the shortest path in an unweighted graph. Every cell at distance 5 gets visited before any cell at distance 6. The first path to reach the goal must be the shortest.
The Rendering System
Both challenges use HTML5 Canvas for drawing. A shared utility provides basic shapes like rectangles and circles. Each shape knows how to draw itself and detect mouse clicks.
The circle shape includes a containment test:
contains(x, y) {
  return this.x - this.radius <= x &&
         this.x + this.radius >= x &&
         this.y + this.radius >= y &&
         this.y - this.radius <= y;
}
This simple bounding box check enables dragging nodes around the canvas.
The rendering happens in layers. First, edges draw between connected nodes. Then nodes draw on top. This ordering prevents edges from covering node labels.
Event Handling
Mouse events drive the interaction. On mouse down, the system checks if the click hit any node. If so, it stores that node as the current selection.
On mouse move, if there is a selection, the system updates that node’s position and redraws everything. On mouse up, it clears the selection.
The maze challenge extends this pattern. Instead of selecting nodes, clicking toggles walls. Dragging extends the toggle across multiple cells. This makes it easy to draw long walls or clear large areas.
Teaching Value
These challenges served their purpose well. Students could see algorithms working instead of just reading about them. They could modify inputs and watch outputs change.
The graph challenge showed that structure matters more than appearance. Dragging nodes around did not change which nodes connected to which. The adjacency matrix stayed the same.
The maze challenge made search algorithms intuitive. Watching the wave spread outward and then tracing back the path gave students a mental model they could apply elsewhere.
Technical Simplicity
I deliberately kept the code simple. No build tools. No transpilation. Just vanilla JavaScript that runs directly in the browser.
This had educational benefits. Students could read the source code. They could modify it. They could see exactly how everything worked without wading through framework abstractions.
The Canvas API is also straightforward. Draw a rectangle. Draw a circle. Draw a line. The low-level nature forced me to think carefully about what I was rendering and why.
What I Learned
Building these challenges taught me that interactivity transforms learning. Static diagrams explain concepts. Interactive tools let students explore them.
I also learned that constraints can help. Limiting myself to vanilla JavaScript meant I had to understand every line of code. No magic hiding in library functions.
The project reinforced that data structures and algorithms are visual. Graphs are networks. Search is exploration. Seeing these relationships animated made abstract ideas concrete.